
Key Takeaways
-
Many investors inform their sentiment about markets by looking for cycles in returns.
-
Rolling returns give a false sense of cyclicality because of overlap among consecutive periods.
-
Investors should avoid basing market expectations on this illusion of predictability.
Investors can be both motivated and well-equipped to see patterns in stock returns. Motivated, because successfully predicting market movements can be lucrative, and well-equipped, because evolution has programmed humans to err on the side of seeing patterns even when they’re not present.1
Many investors believe markets to be cyclical and search for signs of cycle status in an attempt to predict which investment styles are coming into and out of favor. Rolling stock returns are like a Venus flytrap for these investors. Multiyear returns expressed over overlapping periods often appear cyclical, implying prior returns are useful indicators of future returns. However, this is one cycle investors may want to avoid riding; rolling performance simply obscures the volatility in stock returns that is impeding predictability.
One period’s stock return tells you almost nothing about the next.
Optical Illusions
Many economic indicators can be described as cyclical. Measures such as GDP growth, inflation, and employment are relatively slow-moving and therefore highly autocorrelated —their values in any one period are strongly related to their values in the preceding period. Changes in stock market prices, on the other hand, are fast-moving. As such, autocorrelation of stock returns is negligible. One period’s return tells you almost nothing about the next.
Rolling returns look cyclical because of the overlap among rolling periods. For example, five-year rolling returns computed at the end of consecutive months have 59 out of 60 months in common. Rolling windows effectively create a smooth and slow-moving series with massive autocorrelation among observations, masking the underlying sequence of returns.
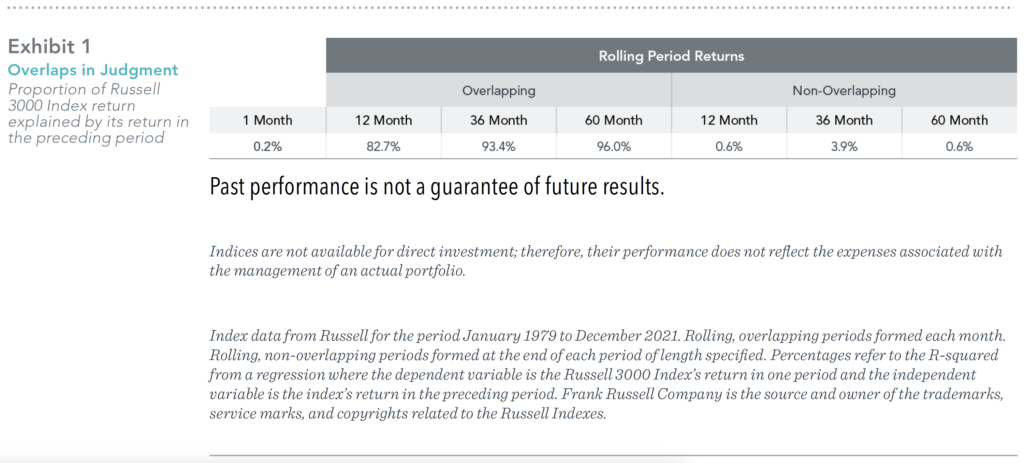
We can see this autocorrelation through the proportion of Russell 3000 Index returns explained by past return observations. A regression of the index’s monthly returns on the return in the preceding month2 produces an R-squared3 of just 0.2%. In other words, consecutive monthly returns have almost no correlation. However, rolling returns measured each month are highly correlated with the rolling return observed the following month—the percent of variation explained ranged from 82.7% using 12-month returns to 96% for five-year returns (see Exhibit 1). These values stand in stark contrast to the regressions of non-overlapping, rolling returns, for which consecutive observations are totally independent.
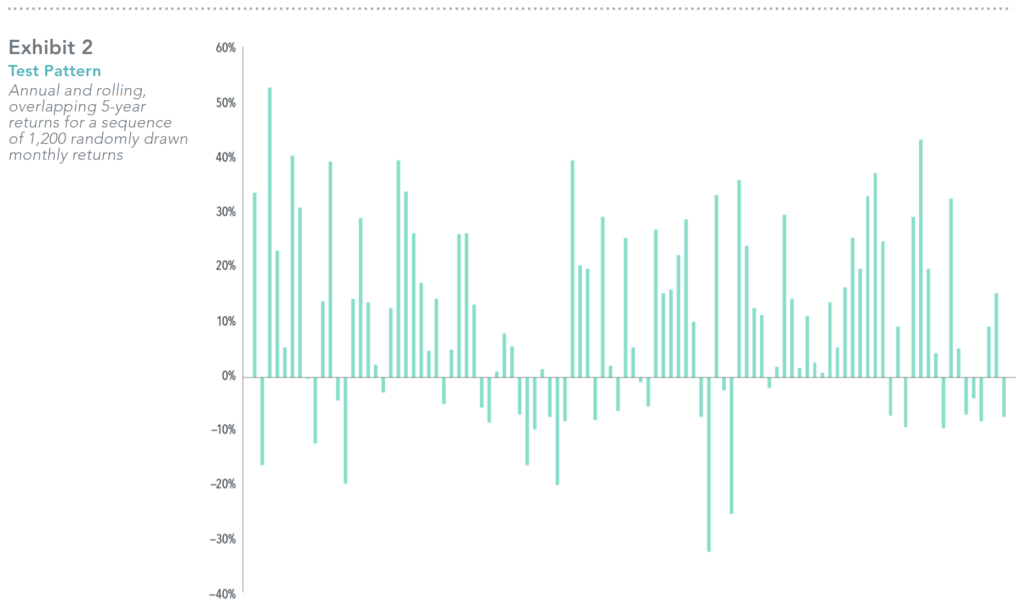
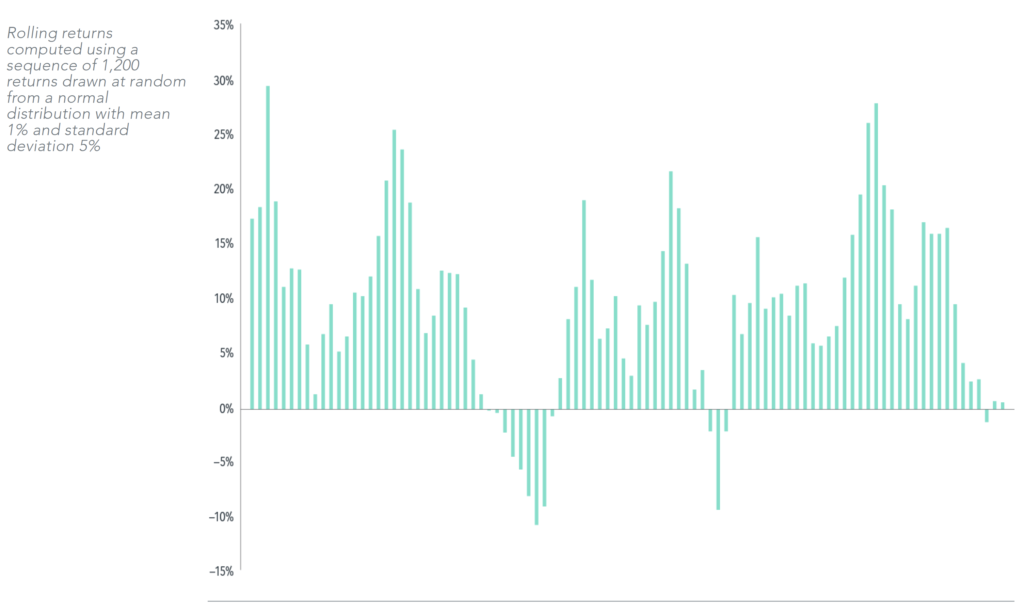
The strong autocorrelation of rolling, overlapping returns produces a cyclical appearance in returns. We can even demonstrate this using a series of returns drawn at random from a normal distribution, essentially precluding autocorrelation. The annual returns of this series, illustrated in the top panel of Exhibit 2, convey the randomness through an absence of any perceptible pattern. However, rolling returns in the bottom panel of Exhibit 2 exhibit periodic waxing and waning that would seem to imply predictability. Of course, the “predictability” is just an artifact of the overlap among consecutive observations. One year’s rolling return clearly has information about the next year’s rolling return, but this is about as insightful as me successfully guessing your name after you tell me what your name is.
Coming Full Circle
A cyclic stock market would present frequent opportunities for market timing. However, the paucity of outperforming active equity managers suggests predicting stock market movements is not that easy. Cyclicality may also imply expected stock returns periodically go negative, a difficult concept to square with a market that reflects risk and return. Stock markets have positive expected returns every day, and research tells us the most reliable way to capture those returns is to stay invested for the long haul.
1. Michael Shermer, “Patternicity: Finding Meaningful Patterns in Meaningless Noise,” Scientific American, December 1, 2008.
2. This is sometimes referred to as an autoregressive (AR) model.
3. An R-squared represents the proportion of the variance that’s explained by the regression.
GLOSSARY
Rolling stock returns: Multiperiod returns expressed at intervals of time.
GDP growth: The growth rate of the total value of goods and services produced by, for example, a country over a set period of time.
Autoregressive model: A process in which an output variable depends linearly on its own previous values.
DIMENSIONAL FUND ADVISORS AND TRIAD ADVISORS ARE NOT AFFILIATED.
The information in this document is provided in good faith without any warranty and is intended for the recipient’s background information only. It does not constitute investment advice, recommendation, or an offer of any services or products for sale and is not intended to provide a sufficient basis on which to make an investment decision. It is the responsibility of any persons wishing to make a purchase to inform
themselves of and observe all applicable laws and regulations. Unauthorized copying, reproducing, duplicating, or transmitting of this document are strictly prohibited. Dimensional accepts no responsibility for loss arising from the use of the information contained herein.
“Dimensional” refers to the Dimensional separate but affiliated entities generally, rather than to one particular entity. These entities are Dimensional Fund Advisors LP, Dimensional Fund Advisors Ltd., Dimensional Ireland Limited, DFA Australia Limited, Dimensional Fund Advisors Canada ULC, Dimensional Fund Advisors Pte. Ltd, Dimensional Japan Ltd., and Dimensional Hong Kong Limited. Dimensional Hong Kong Limited is licensed by the Securities and Futures Commission to conduct Type 1 (dealing in securities) regulated activities only and does not provide asset management services.
Dimensional Fund Advisors LP is an investment advisor registered with the Securities and Exchange Commission.
RISKS
Investments involve risks. The investment return and principal value of an investment may fluctuate so that an investor’s shares, when redeemed, may be worth more or less than their original value. Past performance is not a guarantee of future results. There is no guarantee strategies will be successful.
Share this article:
Investor Risk Capacity Survey
Receive Your Risk Number
Take a 5-minute survey that covers topics such as portfolio size, top financial goals, and what you’re willing to risk for potential gains. We’ll use your responses to pinpoint your exact Risk Number to guide our decision-making process.