
Many investors have likely heard the adage that active management performs better in times of market turbulence. This may sound like an emotional hedge for market stress akin to betting against your favorite sports team to balance an adverse outcome with financial compensation. However, a historical analysis of active US-domiciled equity funds finds no meaningful relation between market volatility and managers’ success rates; the implication is that traditional active investments may compound your concerns during times of market uncertainty.
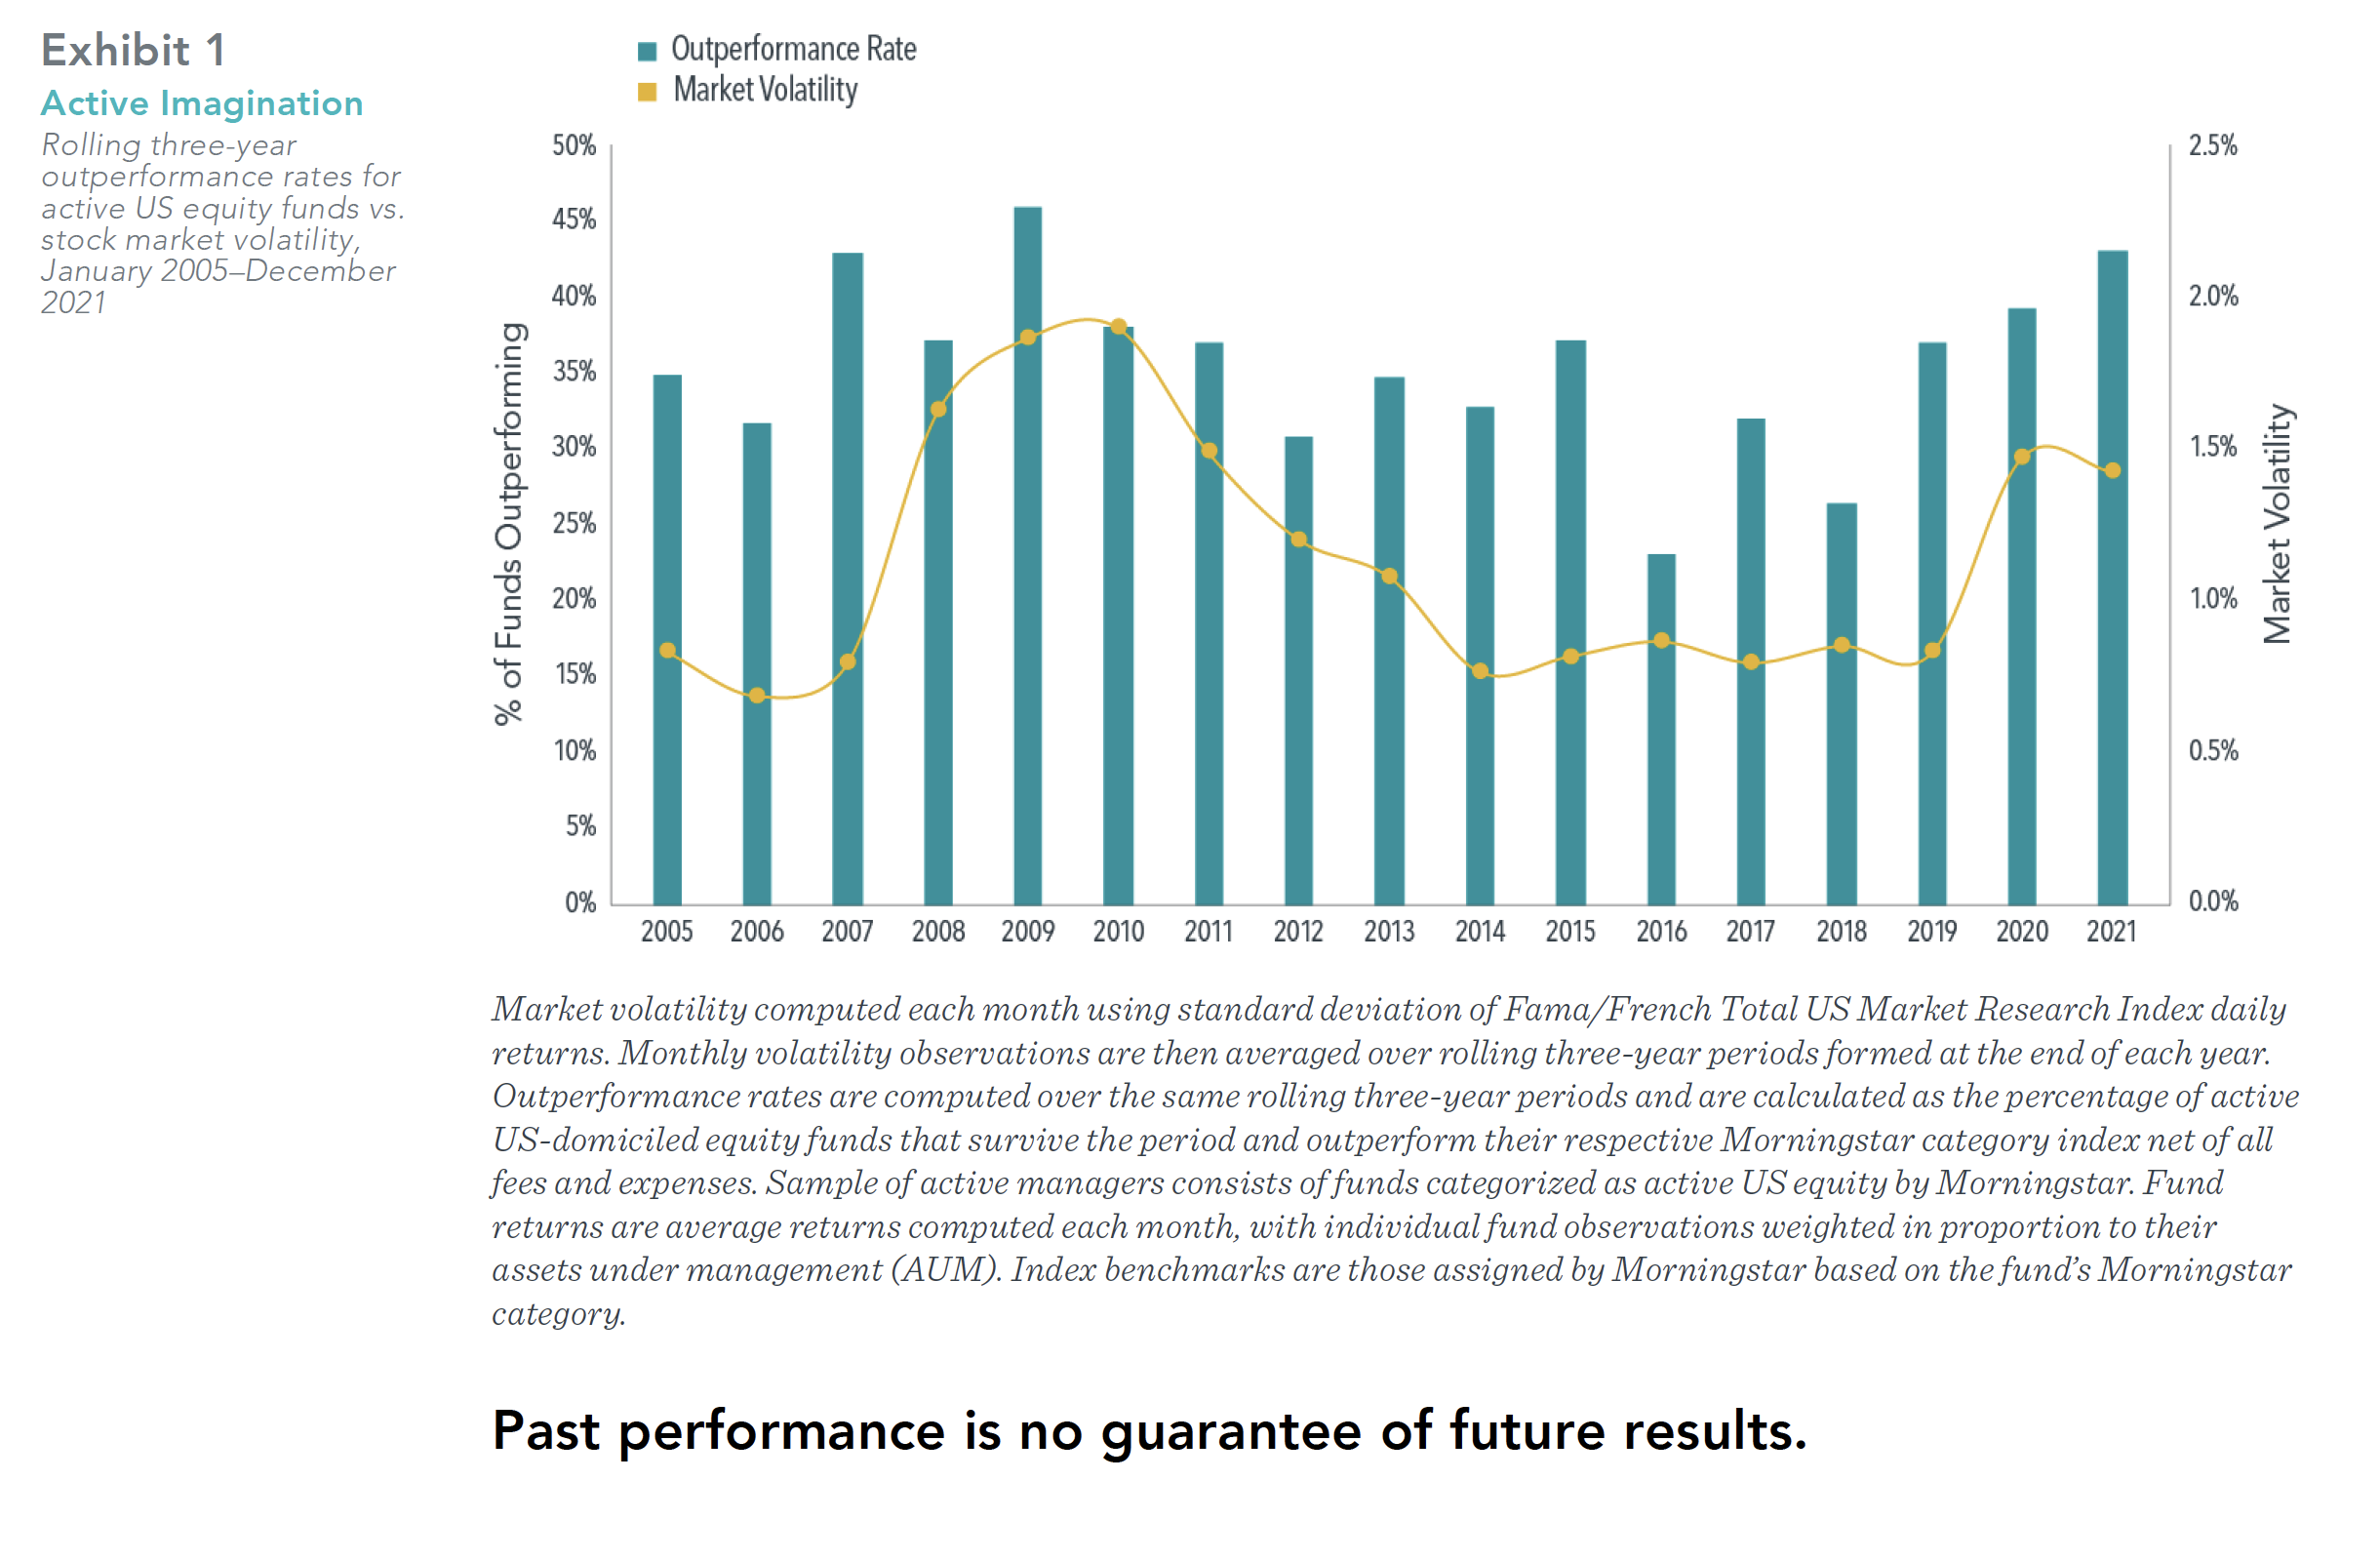
The rolling three-year standard deviation for US stock market returns, illustrated by the orange line in Exhibit 1, shows recent volatility has been at its highest since the 2008 financial crisis. Whether this portends success by active managers is doubtful. The rolling three-year outperformance rates by active US equity funds (blue bars) imply very little relation with volatility levels. The year-to-year variation in success rates does not consistently track market volatility. For example, rolling averages of daily volatility from 2014 to 2019 were consistent in level and yet the percent of funds outperforming during these rolling periods was not, ranging from 23% to 37%.
Volatile market environments give us enough to worry about–investors can do without unpredictable outcomes from traditional active management.
GLOSSARY
Active Management: A portfolio management approach that aims to outperform a market rate or return, or a specific benchmark, by choosing investments that deviate from the market portfolio or benchmark.
Standard Deviation: A measure of the variation or dispersion of a set of data points. Standard deviations are often used to quantify the historical return volatility of a security or portfolio.
DIMENSIONAL FUND ADVISORS AND TRIAD ADVISORS ARE NOT AFFILIATED.
The information in this document is provided in good faith without any warranty and is intended for the recipient’s background information only. It does not constitute investment advice, recommendation, or an offer of any services or products for sale and is not intended to provide a sufficient basis on which to make an investment decision. It is the responsibility of any persons wishing to make a purchase to inform
themselves of and observe all applicable laws and regulations. Unauthorized copying, reproducing, duplicating, or transmitting of this document are strictly prohibited. Dimensional accepts no responsibility for loss arising from the use of the information contained herein.
“Dimensional” refers to the Dimensional separate but affiliated entities generally, rather than to one particular entity. These entities are Dimensional Fund Advisors LP, Dimensional Fund Advisors Ltd., Dimensional Ireland Limited, DFA Australia Limited, Dimensional Fund Advisors Canada ULC, Dimensional Fund Advisors Pte. Ltd, Dimensional Japan Ltd., and Dimensional Hong Kong Limited. Dimensional Hong Kong Limited is licensed by the Securities and Futures Commission to conduct Type 1 (dealing in securities) regulated activities only and does not provide asset management services.
Dimensional Fund Advisors LP is an investment advisor registered with the Securities and Exchange Commission.
RISKS
Investments involve risks. The investment return and principal value of an investment may fluctuate so that an investor’s shares, when redeemed, may be worth more or less than their original value. Past performance is not a guarantee of future results. There is no guarantee strategies will be successful.
Share this article:
Investor Risk Capacity Survey
Receive Your Risk Number
Take a 5-minute survey that covers topics such as portfolio size, top financial goals, and what you’re willing to risk for potential gains. We’ll use your responses to pinpoint your exact Risk Number to guide our decision-making process.