
It’s almost Election Day in the US once again. For those who need a brief civics refresher, every two years the full US House of Representatives and one-third of the Senate are up for reelection. While the outcomes of the elections are uncertain, one thing we can count on is that plenty of opinions and prognostications will be floated in the days to come. In financial circles, this will almost assuredly include any potential for perceived impact on markets. But should long-term investors focus on midterm elections?
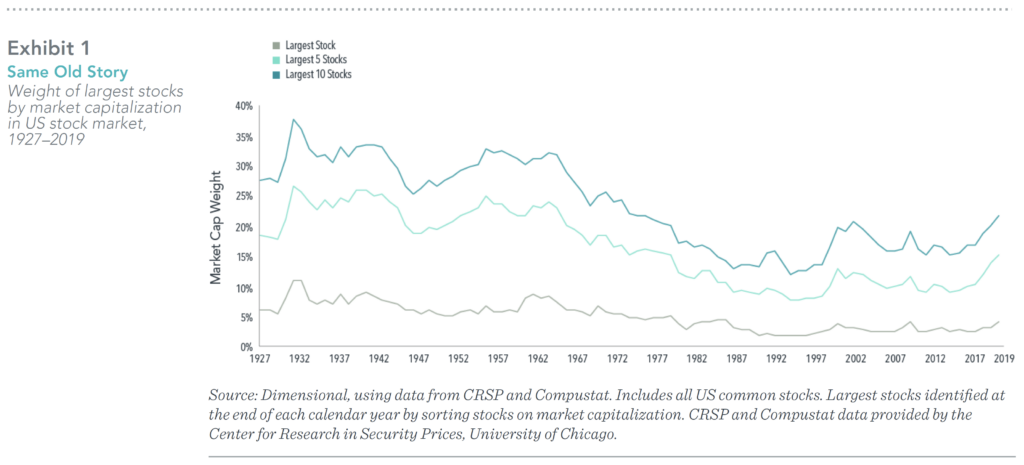
A breakdown of the largest US stocks by decade in Exhibit 2 shows some companies have stayed on top for a long time. AT&T was among the largest two for six straight decades beginning in 1930. General Motors and General Electric ranked in the top 10 at the start of multiple decades. IBM and Exxon were also mainstays in the second half of the 20th century. Hence, concentration of the stock market in a few large companies such as the FAANG stocks in recent years is not a new normal; it is old normal.
Markets Work
We would caution investors against making short-term changes to a long-term plan to try to profit or avoid losses from changes in the political winds. For context, it is helpful to think of markets as a powerful information-processing machine. The combined impact of millions of investors placing billions of dollars’ worth of trades each day results in market prices that incorporate the aggregate expectations of those investors. This makes outguessing market prices consistently very difficult.1 While surprises can and do happen in elections, the surprises don’t always lead to clear-cut outcomes for investors. The 2016 presidential election serves as a recent example of this. There were a variety of opinions about how the election would impact markets, but many articles at the time posited that stocks would fall if Trump were elected.2 The day following President Trump’s win, however, the S&P 500 Index closed 1.1% higher. So even if an investor would have correctly predicted the election outcome (which was not apparent in pre-election polling), there is no guarantee that they would have predicted the correct directional move, especially given the narrative at the time.
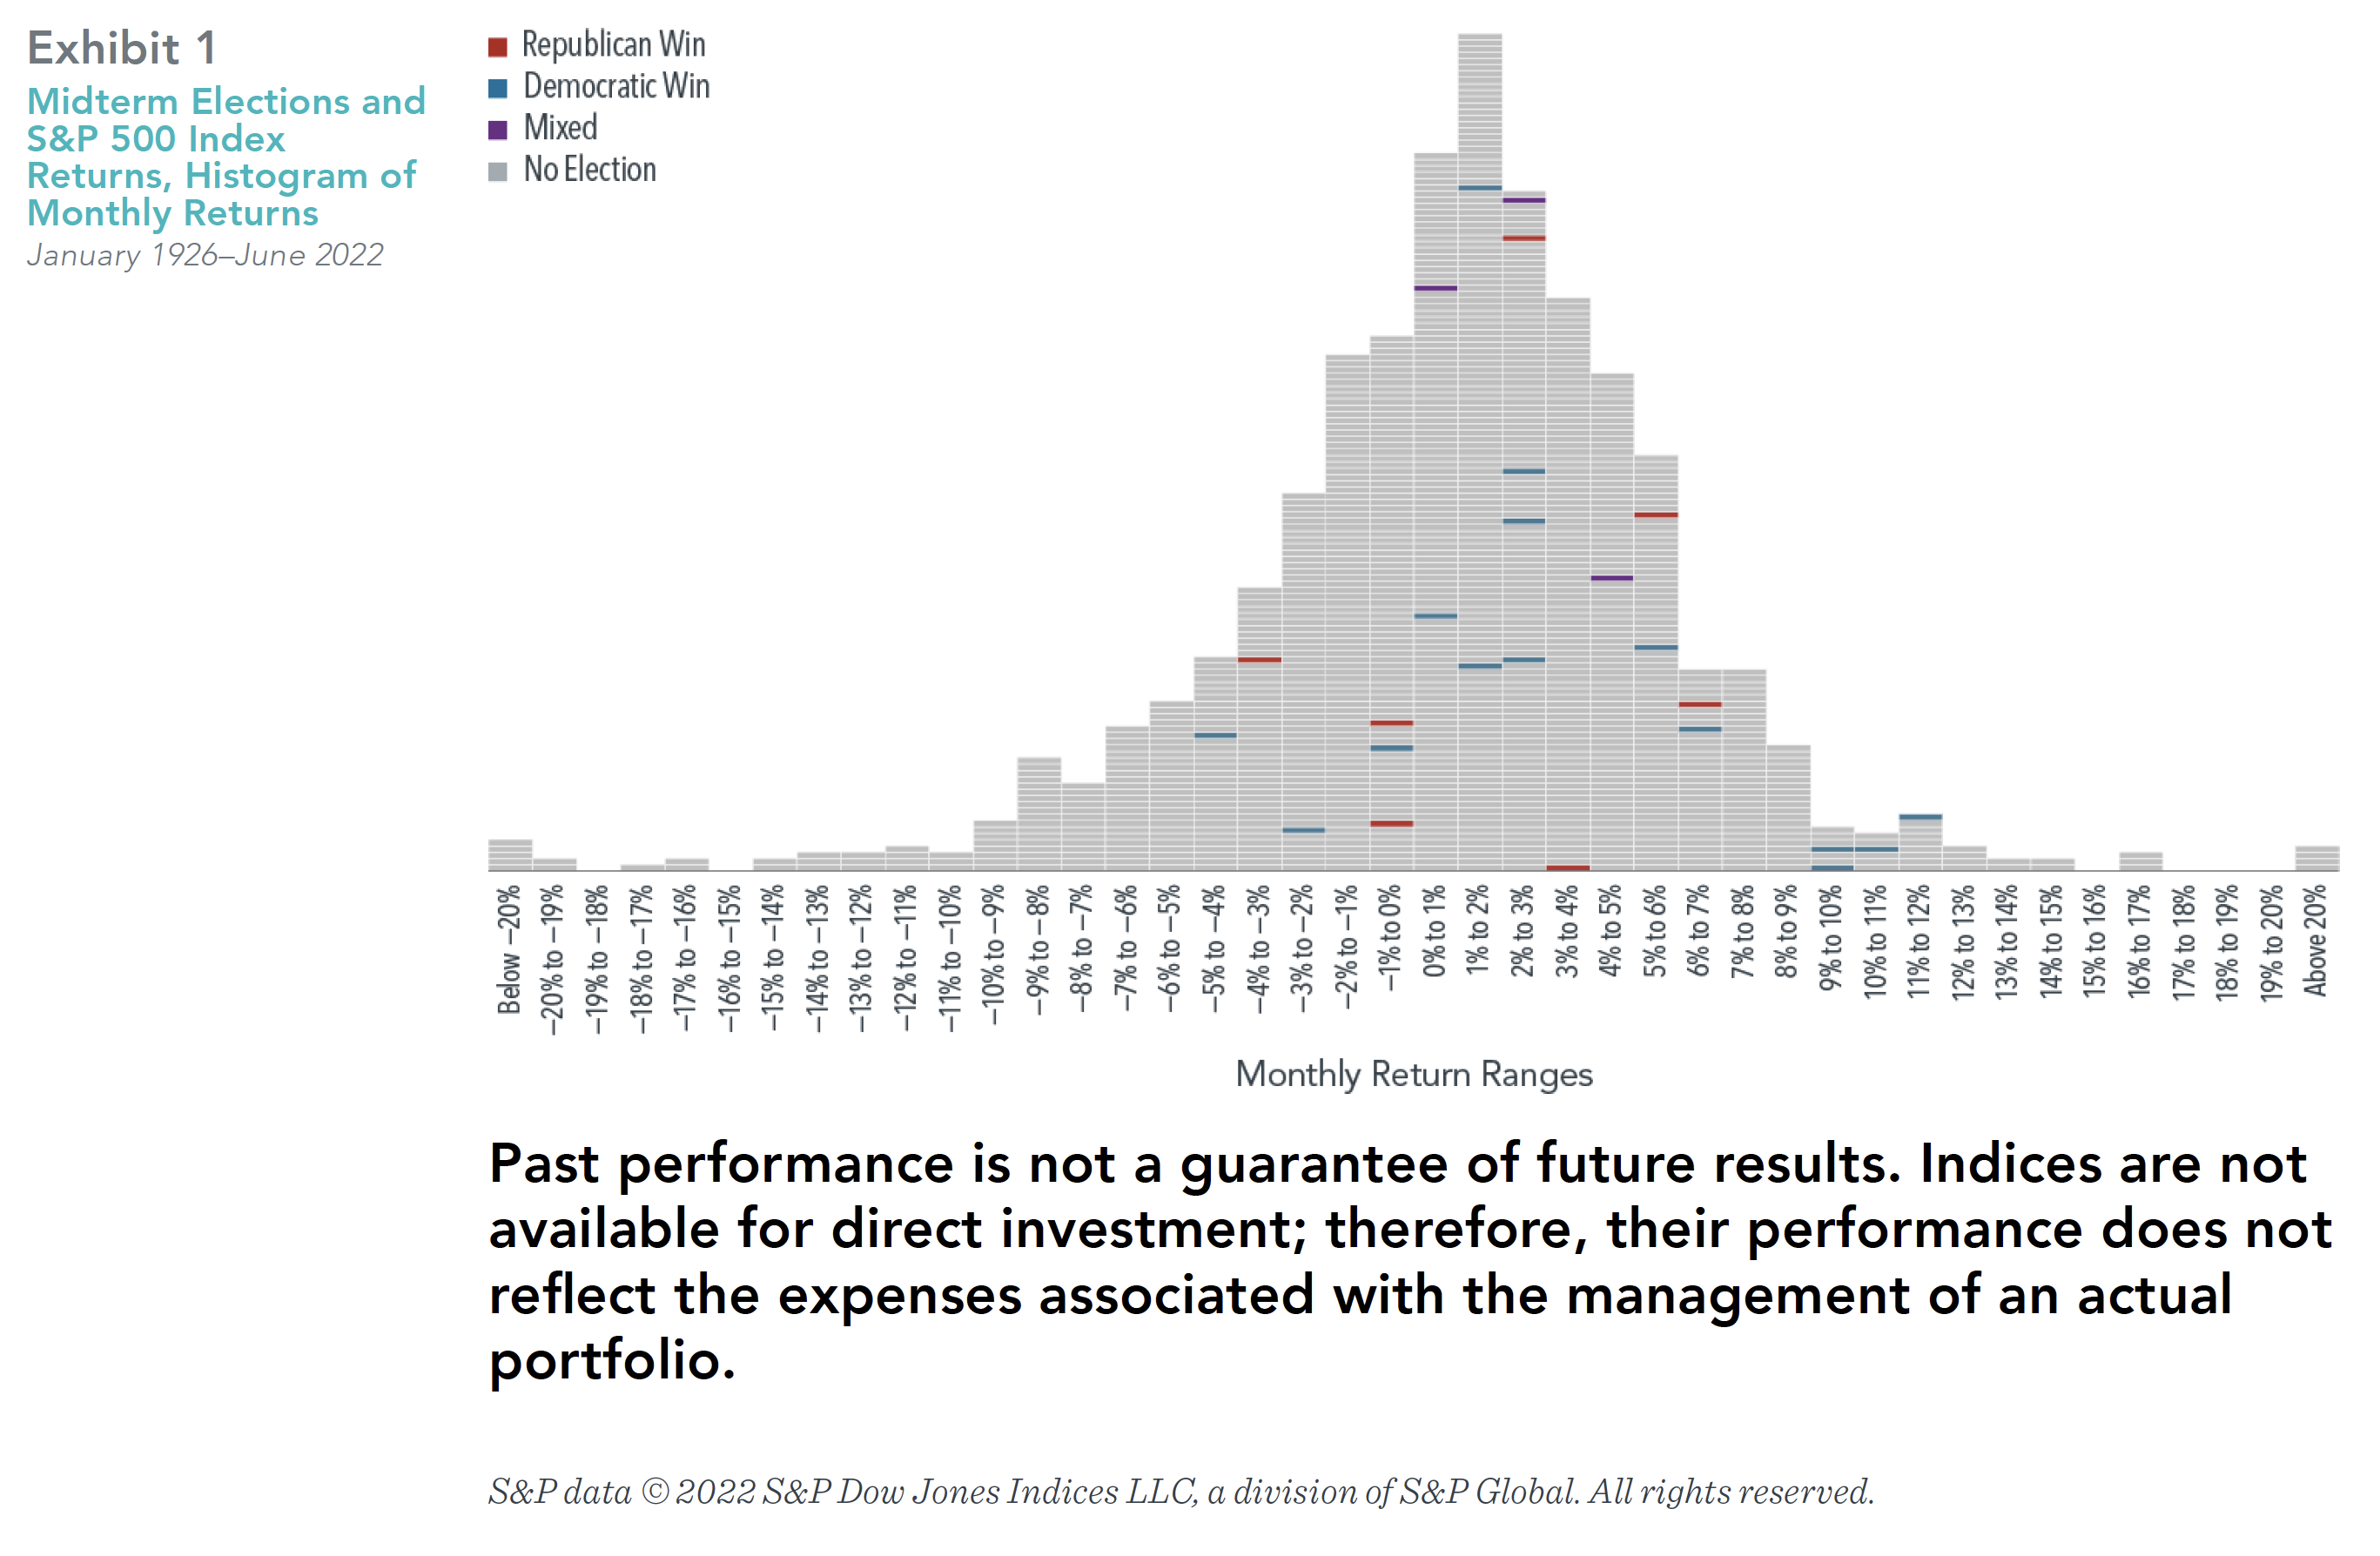
But what about congressional elections? For the upcoming midterms, market strategists and news outlets are still likely to offer opinions on who will win and what impact it will have on markets. However, data for the stock market going back to 1926 shows that returns in months when midterm elections took place did not tend to be that different from returns in any other month.
Exhibit 1 shows the frequency of monthly returns (expressed in 1% increments) for the S&P 500 Index from January 1926–June 2022. Each horizontal dash represents one month, and each vertical bar shows the cumulative number of months for which returns were within a given 1% range (e.g., the tallest bar shows all months where returns were between 1% and 2%). The blue and red horizontal lines represent months during which a midterm election was held, with red meaning Republicans won or maintained majorities in both chambers of Congress, and blue representing the same for Democrats. Striped boxes indicate mixed control, where one party controls the House of Representatives, and the other controls the Senate, while gray boxes represent non-election months. This graphic illustrates that election month returns were well within the typical range of returns, regardless of which party won the election. Results similarly appeared random when looking at all Congressional elections (midterm and presidential) and for annual returns (both the year of the election and the year after).
In it for the Long Haul
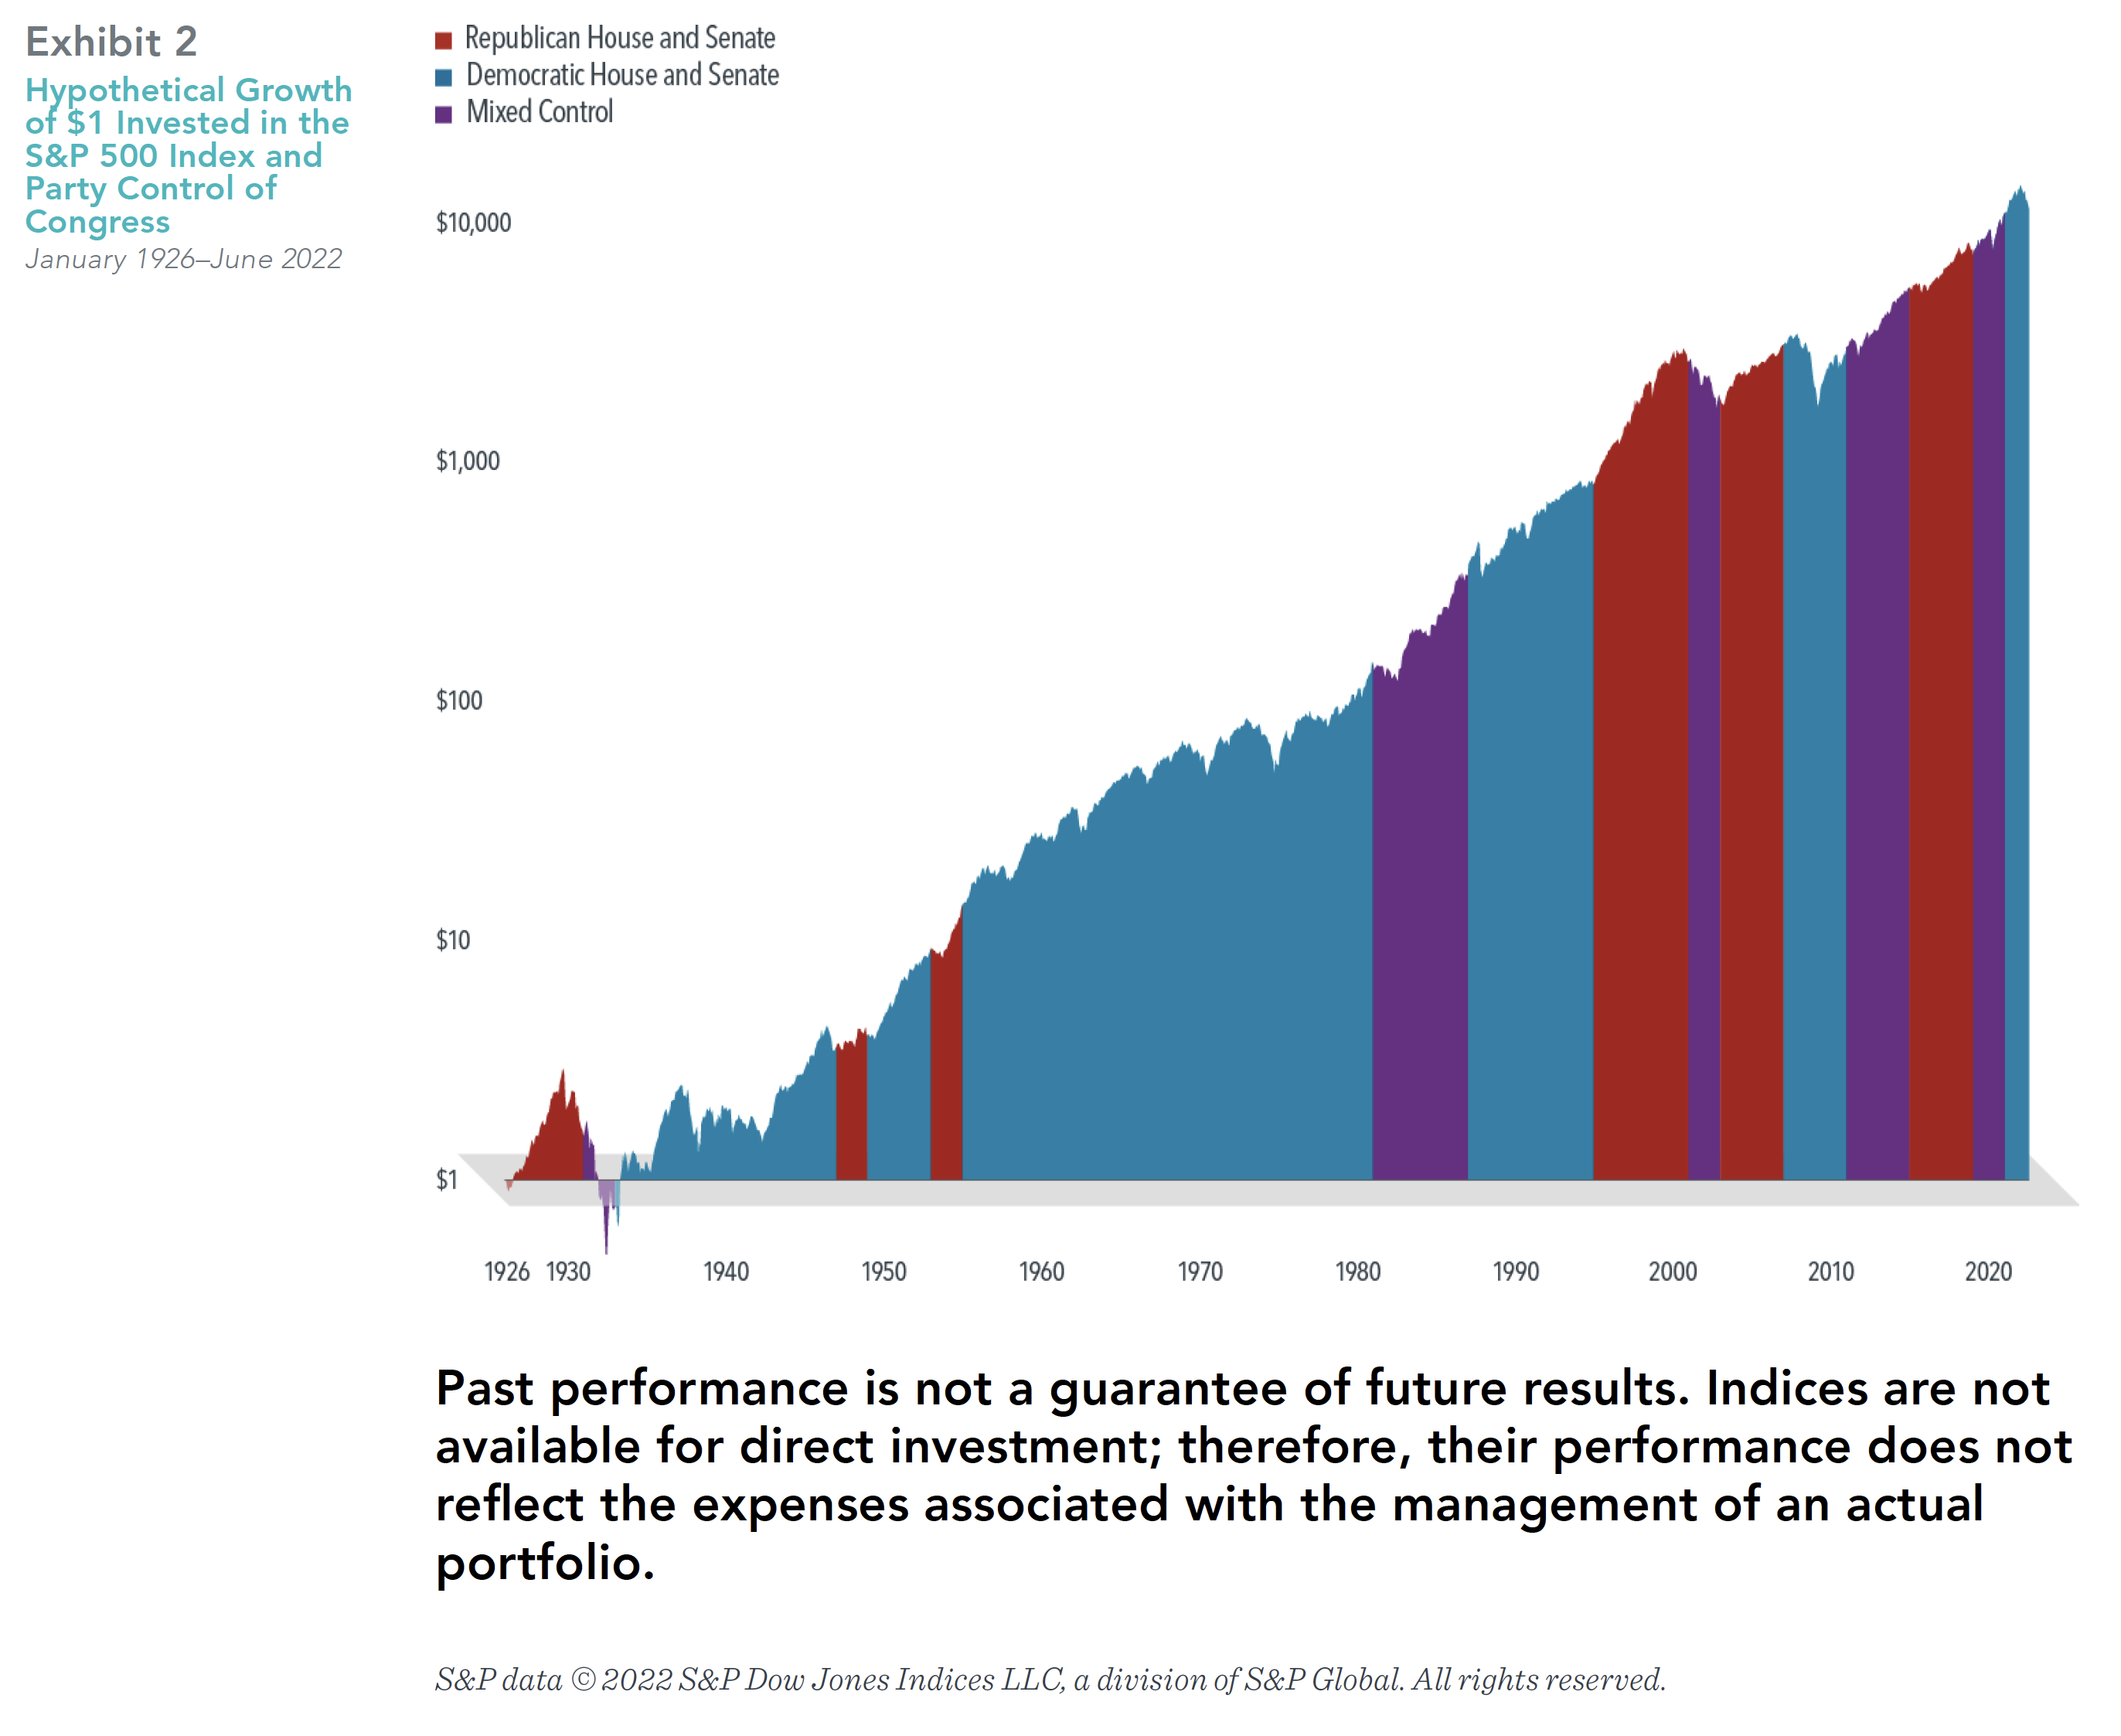
While it can be easy to get distracted by month-to-month or even one-year returns, what really matters for long-term investors is how their wealth grows over longer periods of time. Exhibit 2 shows the hypothetical growth of wealth for an investor who put $1 in the S&P 500 Index in January 1926. Again, the chart lays out party control of Congress over time. And again, both parties have periods of significant growth and significant declines during their time of majority rule. However, there does not appear to be a pattern of stronger returns when any specific party is in control of Congress, or when there is mixed control for that matter. Markets have historically continued to provide returns over the long run irrespective of (and perhaps for those who are tired of hearing political ads, even in spite of) which party is in power at any given time.
Equity markets can help investors grow their assets, and we believe investing is a long- 3 Dimensional Fund Advisors Please see the end of this document for important disclosures. term endeavor. Trying to make investment decisions based on the outcome of elections is unlikely to result in reliable excess returns for investors. At best, any positive outcome based on such a strategy will likely be the result of random luck. At worst, it can lead to costly mistakes. Accordingly, there is a strong case for investors to rely on patience and portfolio structure, rather than trying to outguess the market, to pursue investment returns.
1. This is known as the efficient market theory, which postulates that market prices reflect the knowledge and expectations of all investors and that any new development is instantaneously priced into a security.
2. Examples include: “A Trump win would sink stocks. What about Clinton?” CNN Money, 10/4/16, “What do financial markets think of the 2016 election?” Brookings Institution, 10/21/16, “What Happens to the Markets if Donald Trump Wins?” New York Times, 10/31/16.
DIMENSIONAL FUND ADVISORS AND TRIAD ADVISORS ARE NOT AFFILIATED.
The information in this document is provided in good faith without any warranty and is intended for the recipient’s background information only. It does not constitute investment advice, recommendation, or an offer of any services or products for sale and is not intended to provide a sufficient basis on which to make an investment decision. It is the responsibility of any persons wishing to make a purchase to inform
themselves of and observe all applicable laws and regulations. Unauthorized copying, reproducing, duplicating, or transmitting of this document are strictly prohibited. Dimensional accepts no responsibility for loss arising from the use of the information contained herein.
“Dimensional” refers to the Dimensional separate but affiliated entities generally, rather than to one particular entity. These entities are Dimensional Fund Advisors LP, Dimensional Fund Advisors Ltd., Dimensional Ireland Limited, DFA Australia Limited, Dimensional Fund Advisors Canada ULC, Dimensional Fund Advisors Pte. Ltd, Dimensional Japan Ltd., and Dimensional Hong Kong Limited. Dimensional Hong Kong Limited is licensed by the Securities and Futures Commission to conduct Type 1 (dealing in securities) regulated activities only and does not provide asset management services.
Dimensional Fund Advisors LP is an investment advisor registered with the Securities and Exchange Commission.
RISKS
Investments involve risks. The investment return and principal value of an investment may fluctuate so that an investor’s shares, when redeemed, may be worth more or less than their original value. Past performance is not a guarantee of future results. There is no guarantee strategies will be successful.
Share this article:
Investor Risk Capacity Survey
Receive Your Risk Number
Take a 5-minute survey that covers topics such as portfolio size, top financial goals, and what you’re willing to risk for potential gains. We’ll use your responses to pinpoint your exact Risk Number to guide our decision-making process.