
Anyone who’s ever bought a used car knows the importance of avoiding a cherry-picked depiction of history. Low mileage and regular oil changes don’t matter much if the seller fails to mention the car was once submerged in floodwater.
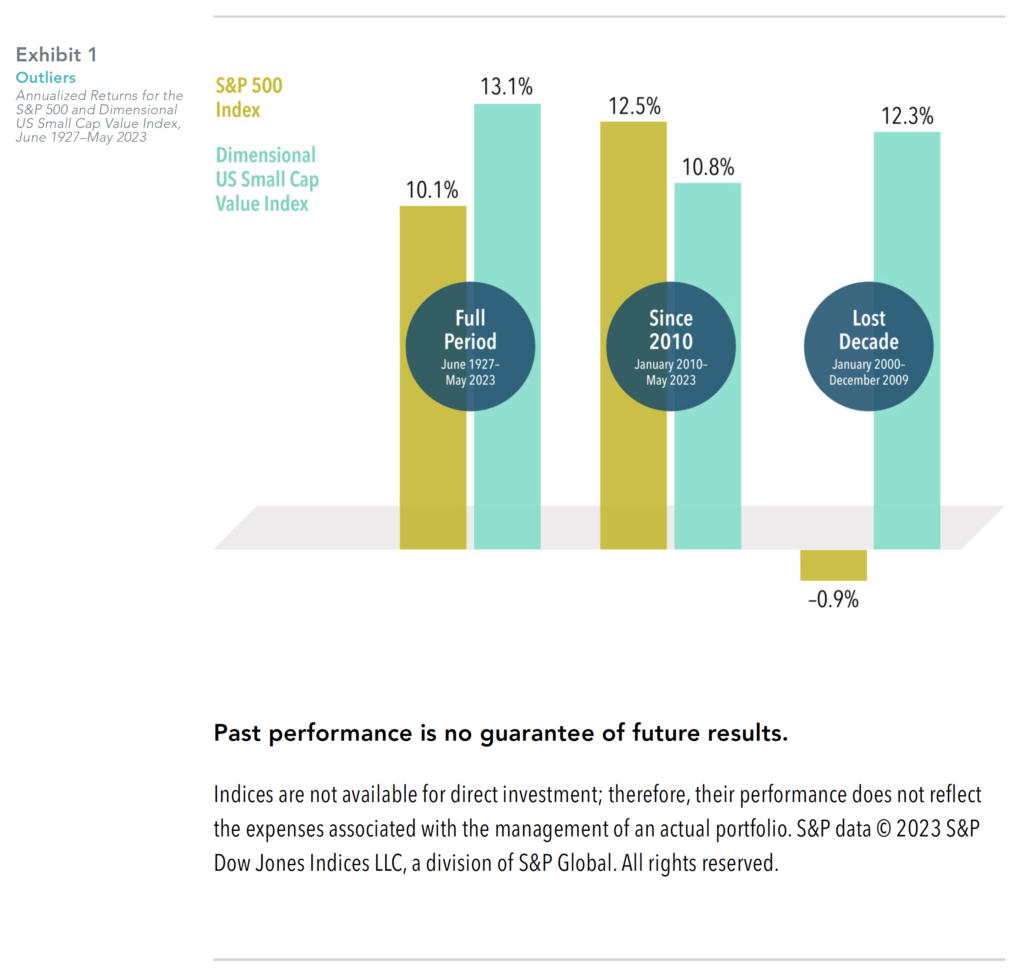
Many investors have been drawn to the shiny-object stocks of the S&P 500 index on account of their recent performance—since 2010, the large cap S&P has outperformed US small cap value stocks1 by an annualized 1.7 percentage points.2 However, this impressive period for the S&P was immediately preceded by the “lost decade” (January 2000–December 2009), when the index returned –0.9%, or more than 13 percentage points behind US small cap value stocks.
Using the full data history provides perspective. Since June 1927, US small cap value stocks outperformed the S&P, 13.1% to 10.1%. The full sample also depicts the subperiods as aberrations for the S&P 500. Beating small cap value stocks over 14 years and returning less than zero over 10 years both seem unlikely expectations for the long term. Small cap value stocks, by comparison, have been more consistent in these subperiods.
1. US small cap value stocks represented by the Dimensional US Small Cap Value Index. The index is defined as companies whose relative price is in the bottom 35% of the Dimensional US Small Cap Index (a market-capitalization-weighted index of securities of US companies whose market capitalization falls in the lowest 8% of the total market capitalization of the eligible market) after the exclusion of utilities, companies lacking financial data, and companies with negative relative price. The eligible market is securities of US companies traded on the NYSE, NYSE MKT (formerly AMEX), and Nasdaq Global Market. Exclusions: non–US companies, REITs, UITs, investment companies, and companies with the lowest profitability within the small cap value universe. The index excludes companies with the highest asset growth within the small cap universe. Profitability is defined as operating income before depreciation and amortization minus interest expense divided by book equity. Asset growth is defined as the change in total assets from the prior fiscal year to current fiscal year. Data source: CRSP and Compustat.
The Dimensional US Small Cap Value Index has been retrospectively calculated by Dimensional Fund Advisors LP and did not exist prior to the index inception date. Accordingly, results shown during the periods prior to the index inception date do not represent actual returns of the index. Other periods selected may have different results, including losses. Backtested index performance is hypothetical and is provided for informational purposes only to indicate historical performance had the index been calculated over the relevant time periods. Backtested performance results assume the reinvestment of dividends and capital gains. The Dimensional US Small Cap Value Index reflected above is not a “financial index” for the purpose of the EU Markets in Financial Instruments Directive (MiFID). Rather, it represents academic concepts that may be relevant or informative about portfolio construction and is not available for direct investment or for use as a benchmark.
2. January 1, 2020–May 31, 2023. Indices are not available for direct investment; therefore, their performance does not reflect the expenses associated with the management of an actual portfolio. S&P data © 2023 S&P Dow Jones Indices LLC, a division of S&P Global. All rights reserved.
DIMENSIONAL FUND ADVISORS AND TRIAD ADVISORS ARE NOT AFFILIATED.
The information in this document is provided in good faith without any warranty and is intended for the recipient’s background information only. It does not constitute investment advice, recommendation, or an offer of any services or products for sale and is not intended to provide a sufficient basis on which to make an investment decision. It is the responsibility of any persons wishing to make a purchase to inform
themselves of and observe all applicable laws and regulations. Unauthorized copying, reproducing, duplicating, or transmitting of this document are strictly prohibited. Dimensional accepts no responsibility for loss arising from the use of the information contained herein.
“Dimensional” refers to the Dimensional separate but affiliated entities generally, rather than to one particular entity. These entities are Dimensional Fund Advisors LP, Dimensional Fund Advisors Ltd., Dimensional Ireland Limited, DFA Australia Limited, Dimensional Fund Advisors Canada ULC, Dimensional Fund Advisors Pte. Ltd, Dimensional Japan Ltd., and Dimensional Hong Kong Limited. Dimensional Hong Kong Limited is licensed by the Securities and Futures Commission to conduct Type 1 (dealing in securities) regulated activities only and does not provide asset management services.
Dimensional Fund Advisors LP is an investment advisor registered with the Securities and Exchange Commission.
RISKS
Investments involve risks. The investment return and principal value of an investment may fluctuate so that an investor’s shares, when redeemed, may be worth more or less than their original value. Past performance is not a guarantee of future results. There is no guarantee strategies will be successful.
Share this article:
Investor Risk Capacity Survey
Receive Your Risk Number
Take a 5-minute survey that covers topics such as portfolio size, top financial goals, and what you’re willing to risk for potential gains. We’ll use your responses to pinpoint your exact Risk Number to guide our decision-making process.